11. ONS ad hoc teachers study, Nov 2020
"It is not the role of the ONS to manufacture false evidence for purposes of state propaganda" Complaints made regarding paper cited by UK Government, WHO, UNICEF etc
Published at the start of November 2020, the ONS ad hoc teachers study was an analysis of a snapshot of data taken from 2 September to 16 October. The paper was provided by government to justify its decisions on schools.
On 3 Nov, the Department for Education tweeted a video of Chris Whitty saying:
“All the data, including ONS data, do not imply that teachers are a high risk occupation, unlike, for example, social care workers, and medical staff like myself.”
The statement spread across the media, it was used to dismiss calls to tackle transmission by union representatives and experts not working with government agencies. The statistic is still quoted by the media, campaign groups against measures and those professionals working with the government who seem serenely comfortable with the mass infection of children. The ad hoc analysis became a staple reference cited by government committees, the RCPCH, the WHO TAG’s on covid and schools, the JCVI, the Children’s Finish Taskforce and many academic papers on covid in schools.
The ad hoc teachers study was intended to examine the risk to education workers due to a request from the SAGE schools group. A few ONS authors took a look at the data from random sampling to compare risk to other occupations, however the sample size was so small it was almost impossible to generate statistically significant evidence.
Despite this the results were reported as showing "no evidence of difference", which was a breach of the Office for Statistics Regulation's code of conduct.
To compound matters, while the sample size was too small, the results did suggest risk may be higher in teachers and teaching assistants. The study’s interpretation of the results looked at teachers who were known to work in schools, however the data set contained a larger number of teachers in unspecified settings, the risk to this group was much higher albeit with a wide estimated range. Considering the vast majority of those working as teachers were working in schools, it’s likely many of those classed as unspecified are working in schools.
This reporting led to authorities and researchers claiming "ONS data found no difference" which was yet another example of no evidence being misrepresented as "no evidence of…" This quote then became a "fact" which has been cited by authorities, media and other academic papers.
The paper’s lead author Shamez Ladhani, the UK’s clinical lead on covid in children was also a member of the WHO’s technical advisory group for covid in schools and a member of the WHO’s European region’s technical advisory group. The paper was presented in these TAG meetings leading it to be cited in WHO documents, and due to the TAG’s work with UNICEF, the study was also cited in UNICEF guidance supported by a number of large international organisations including the UN and the World Bank.
This was not a rigorous study, it was an ad hoc analysis of a small data set. Was this the best data set or paper available to the WHO? The minutes of the WHO meetings did not note much in the way of scrutiny of the studies cited in meetings or the conclusions given. Was there a sense of trust between members
The ONS data mentioned in the statement wasn’t published until a few days after the statement made headlines. effectively the pre-release shut down debate on the risks to education workers as the statement became an established fact before the source data was publicly available.
What received much less reporting and seems to have been entirely forgotten by most (unlike the still quoted ad hoc ONS survey) is the formal complaint lodged with the UK Statistics Authority by Sarah Rasmussen, a mathematician on secondment to Cambridge University at the time.
https://twitter.com/SarahDRasmussen/status/1343639137287593988?s=20
Reported breach to the UK Statistics Authority
From a combination of Rasmussen’s threads on the subject.
Today I reported an ONS breach to the UK Statistics Authority.
Two breaches in fact: one regarding an “ad hoc” analysis on education staff in part 9 of the 6 Nov ONS covid survey pilot, and one for a related 3 Nov government leak
According to the UK Statistics Office “Code of Practice for Statistics,” this was a breach of trustworthiness principle T3: Orderly release.
T3.4 states that “ahead of their publication [...] no indication of the statistics should be made public.”
T3.8 says “Policy, press or ministerial statements referring to regular or ad hoc official statistics should [...] contain a prominent link to the source statistics.”
This 3 Nov announcement led to confusion, as before 6 Nov, the only published occupation-differentiated ONS covid data was on deaths during spring lockdown.
And although Whitty said “all the data, including ONS,” he never ended up identifying non-ONS data on this topic.
The more important breach, though, has to do with the 6 Nov ad hoc analysis itself, which defied the “Code of Practice for Statistics” in so many ways as to raise serious concerns about independence.
Though the other analyses in this 6 Nov report used data through *31 Oct* & included time dependence, the ad hoc teacher analysis only used 2 Sep-*16 Oct* data, & suppressed time dependence.
This matters: 17 Oct is about when 2-11-yr-olds overtook 35-49-yr-olds in infection.
Why omit the 17-31 Oct occupation data—especially when this omission was so likely to bias results?
Did they feel they had run out of time to analyse already-acquired data? Code of Practice says that’s an unacceptable reason, especially considering the 3-day-early leak.
On the other hand, with teacher training, many schools started Mon 7 Sep instead of Thu 2 Sep. Infection takes time to incubate before testing positive.
So up to 10 days worth of their early data predated the option for school-acquired infection, diluting total positivity results for teachers.
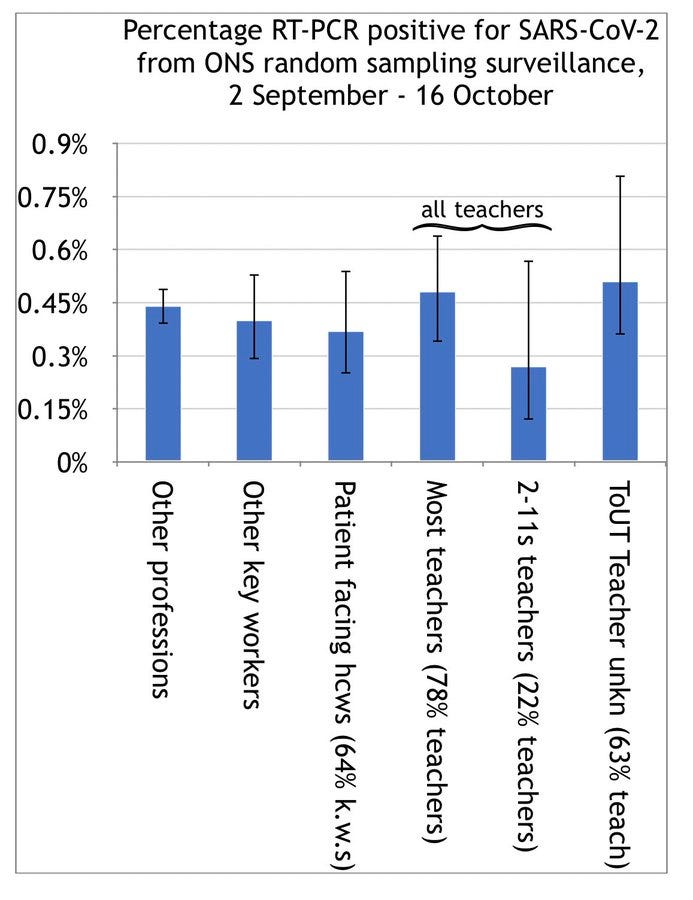
Wait, it gets worse: just LOOK at the error bars!
Data was disaggregated in such a way as to make the study totally underpowered.
Error bar width is
>2 times the positivity value for most edu categories,
>33% higher than positivity for ALL BUT ONE edu category.
So really, the chart should have just looked like the one below, with more sensible error bars, and with teachers in the highest positivity category by far, even without the 17-31 Oct data.
It was only the disaggregation of teachers into underpowered buckets that made it plausible for ONS to claim: “Data [...] show no evidence of differences in the positivity rate...” in the text and “there is no evidence of difference in the positivity rate” in the caption.
These “no evidence of differences” comments don’t mean what the audience is intended to think they mean. Rather, they mean, “we disaggregated and restricted the data in such a way as to make the analysis too underpowered to generate significant evidence.”
This badly violates the Code for Practice, and saying “no evidence of difference” vs “evidence of no difference” isn’t a get-out-jail-free card. Context matters. Readers expect that if you publish an ONS analysis, the verdict is not: this was underpowered by design.
The ONS are also obligated to provide rationale for substantial deviations from standard methodology, such as why they omitted 17-31 Oct data and suppressed time dependence for this one analysis, in a report that consistently provided time-dependent data through 31 October.
On a side note, it contradicts Swedish findings. In spring, Swedish teachers of upper sec schools (fully remote) had median infection rates. Teachers of (fully open) lower sec schools had nearly twice the % of confirmed cases, and were among the most infected professions.
It is not the role of the ONS to manufacture false evidence for purposes of state propaganda. This message of this one analysis was
-announced by Chris Whitty on 3 Nov,
-tweeted by the Department for Education on 3 Nov,
-invoked by SAGE in the 4 Nov (published 13 Nov) report “TFC: Children and transmission 4 Nov, 2020,” where it was the only included “evidence” on teacher risk—in fact they (predictably) changed “no evidence of difference” to “show no difference”,
-tweeted on 13 Nov by the Department for Education (this time by invoking the 4 Nov SAGE report) as new evidence of school safety, even though much of the actual child-related data in the report involved strong evidence of substantial transmission,
-and invoked 18 Nov by Scottish Government as part of their evidence of school safety from covid, again, “no evidence of difference” became “found there is no difference.”
Many other captions in the same report pointed out a visible trend (even a tiny one), and silently left it up to readers to notice that error bars/ confidence intervals added uncertainty that might invalidate the trend the caption had observed.
Also, of all 28 ONS Infection Survey Pilots, the phrase “no evidence” shows up in only 4 other contexts. Unlike the 6 Nov ad hoc case, all 4 of these other instances include *explanations* of why they stated “no evidence,” and all mention confidence intervals (error bars).
Also, the Code of Practice for Statistics emphasises that quality assurance, and discussion of strengths and limitations (eg inadequate data, uncertainty, and factors that might distort or bias results) should be proportionate to the *importance* and *use* of the data.
Additional issues with ONS studies raised by Rasmussen
The ONS study named 4 teacher categories: nursery (4%), primary (18%), secondary (23%), and Teacher of unknown type [ToUT] (63%).
Teachers of Unknown Type was largest: included anyone who wrote “teacher” or “teaching assistant” instead of eg “primary teacher” or “primary teaching assistant.” 2/10
If you separate out the named primary+nursery group (22%), the remaining “Most teachers” group (78%) was notably higher than Other professions, Other key workers, & Patient facing key workers.
It’s only “no evidence” because so low confidence, due to tiny sample size. 3/10
Plus, it makes sense to separate out the primary+nursery group, because 2-11yr-olds had half the prevalence of secondary students for the time period relevant to teacher infections counted in the study.
And this cut off just before a disproportionate surge for 2-11yr-olds. 4/10
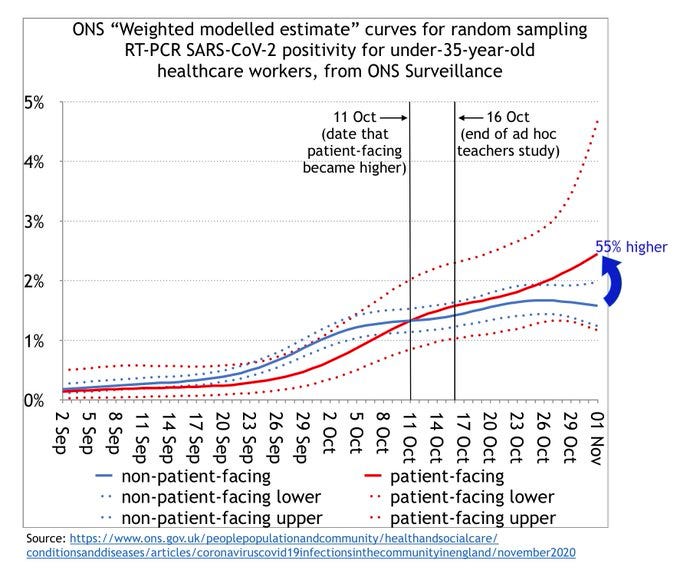
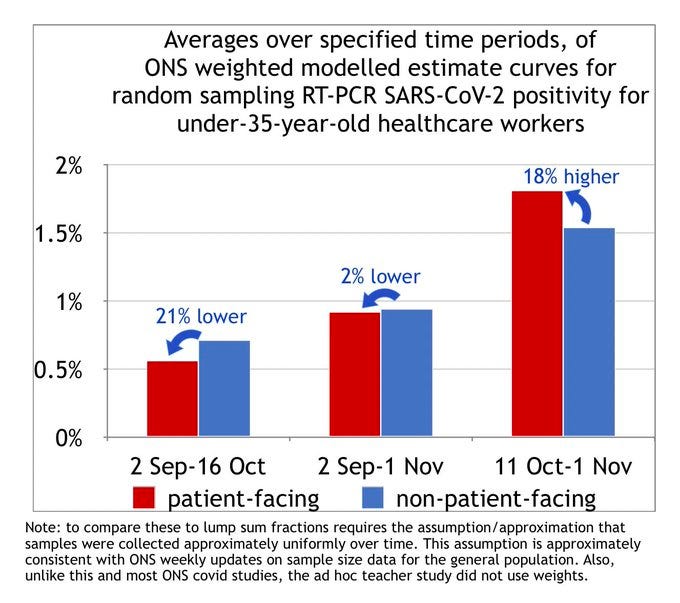
In context of risk differences that increase over time, taking lump sums (vs showing time dependence) reduces the apparent risk difference.
Eg, using the same methods for a later ONS healthcare worker study would have produced opposite conclusions to that study’s findings. 5/10
Although a Public Health Scotland study appealed to the 2 Sep-16 Oct ONS teacher study to cast doubt on the PHS study’s own findings, it found a
1.47 (1.37-1.57) confirmed case hazard ratio (ie 47% higher) for teachers 3 Sep-26 Nov, vs age/sex-controlled comparators. 6/10
Since teachers had far fewer 51-65-yr-olds than the general population and these 51-65yo teachers had lower relative case count, the hospitalisations HR then for teachers as a whole was .98 (.67-1.45). Even then, this broad CI overlapped that for teacher cases (1.37-1.57). 7/10
The PHS study authors felt their hospitalisations HR raised doubts on their cases HR—despite the former’s consistence with age-stratified cases data. Their speculations that high case HRs might just be due to increased tests are not supported by test data in their appendix. 8/10
I bring this PHS study up because there are so few UK covid studies from THIS SCHOOL YEAR comparing teachers to other groups.
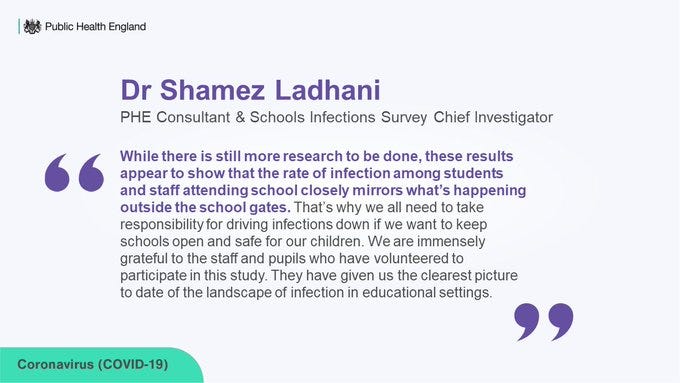
Sadly, that didn’t stop the PHE press office from suggesting invalid comparisons the ONS had specifically warned against making (for a third study). 9/10
And of course, all these studies took place before the B117 variant gained regional dominance.
We’re in utterly new territory now. No one, including Matt Hancock, should continue using words like “is” for a study from 2 Sep-16 Oct
...even if he gets the study wrong. 10/10
UK Statistics Authority Response
Presentation of statistics in the Office for National Statistics bulletin
You highlighted concerns about the ad hoc analysis published by ONS as part of the COVID-19 Infection Survey results on 6 November. We do not think that ONS intentionally presented the analysis in a misleading way. However, there are some changes which could have been made to the analysis and the accompanying text to support those reading the bulletin in understanding the analysis.
ONS has published a statement in response to some of the concerns raised about the analysis, which addresses some of the issues you raised. We have also considered the concerns:
End date of the analysis: ONS explained that the ad hoc analysis only covered the time period up to 16 October, not 31 October like other analysis in the bulletin, because the occupation data requires further processing and is only available around two weeks after the initial headline results. This meant that outputs could not be produced as quickly for this analysis as other parts of the publication. It would have been helpful if ONS had given a rationale for the discrepancy when the data were first published.
Evidence of a change: We agree that ONS could have done more to explain the uncertainty around the estimates for education staff categories, and the implications of this. It could have been clearer that no evidence of a difference is not the same as evidence of no difference. It should also have explained the impact of small numbers of cases in some categories on the ability to determine any differences. ONS has now updated the analysis to include “all teachers” in one category.
Use of data by the Chief Medical Officer (CMO) prior to publication
My team has also looked into the timeline for the sharing of information between ONS and the UK Government and SAGE. In our view the CMO was not quoting the ad hoc analysis published by ONS on 6 November when he addressed the Science and Technology Committee on 3 November. ONS shared the results of the analysis with SAGE on 4 November, which was then referenced in the report that was made public on 13 November. We have been told that the evidence which informed the CMO’s response on 3 November included other published ONS data, data on COVID-related deaths by occupation. His response was consistent with the Statement from the UK Chief Medical Officers on schools and childcare reopening made in August 2020, though we would have liked to see clearer references to the evidence quoted in this statement.
The Coronavirus (COVID-19) Infection Survey is a critical source of information on the pandemic, so it is important that the statistics meets the highest standards of the Code of Practice for Statistics. We will investigate further the issues you have raised with us as part of our in-depth review of the trustworthiness, quality and value of the Infection Survey statistics.
Yours sincerely
Ed Humpherson
Director General for Regulation
ONS Statement
he ONS was clear at the time that based on this analysis, “there was no evidence of any difference” within our survey. This is not the same as saying that, “there is no difference”.
When looking at how the data were aggregated, different types of teachers experience different circumstances in the classroom, which could have an effect on their chance of being infected with COVID-19. As a result, we took the decision to publish data with more detail to give more information.
In response to questions around the aggregation of different occupations, we have reproduced this analysis with the teachers group combined. This also shows no clear evidence from our survey as to whether there is a difference in the level of individuals who would test positive for COVID-19 between teachers and other key workers.
We take seriously the need to provide more information on schools. In addition, we are carrying out a Schools Infection Survey that was launched in October. This survey samples around 100 secondary schools and includes testing of pupils and all staff in schools. The first round of testing has just been completed and we are analysing results.
Summary
While the ONS statement acknowledged the limitations of the small data set and highlighted that no evidence is not the same as no difference this didn't stop the ad hoc study continuing to be cited as evidence that teachers were at no greater risk. Of course certain politicians, media outlets and campaign groups decided to reinterpret “no greater risk” as “lower risk”.
It became another reassuring “fact”, just like a previous claim that there was no evidence of a child infecting at adult had gained traction in April and May 2020. Why did such a low powered ad hoc study using small sample sizes come to receive so much media attention and why was it relied on to inform policy?
In the UK according to the ONS education workers now have the second highest rate of long covid of any profession while the data on teachers deaths has been unavailable for a couple of years, and there has been no effort to collect and compile data on support staff deaths.
Going forward the UK Government relied on the the Schools Infection Survey led by Shamez Ladhani. The issues raised regarding these surveys will be covered in a future part of this review.
10. How did the WHO's TAGs on covid in children respond to the Alpha wave?
This section of the review examines the discussions had by WHO TAGs as variants were on the rise around the world. Of most consequence was the Alpha variant emerging in the UK which would lead to the UK’s deadliest wave, other variants that emerged in the second wave included Beta in South Africa and Gamma in Brazil.
9. June - Oct 2020: UK influence on WHO Schools groups
COUNTER DISINFORMATION PROJECT
·
28 MAY
8. Autumn 2020: How contact testing in UK schools collapsed
COUNTER DISINFORMATION PROJECT
·
21 MAY
7. Why did the UK ignore calls for a September circuit breaker?
13 May
6. Who wrote the September 2020 schools guidance?
COUNTER DISINFORMATION PROJECT
·
26 APR
5. Suppression of scientific debate on transmission in children
COUNTER DISINFORMATION PROJECT
·
16 APR
4. Evidence for "Back to school" June 2020 DfE Guidance
COUNTER DISINFORMATION PROJECT
·
13 APR
3. UK Influence: Viner, Farrar, Fauci emails & ESPID
COUNTER DISINFORMATION PROJECT
·
9 APR
2. March - April 2020 "No child is known to have passed on Covid-19 to an adult"
COUNTER DISINFORMATION PROJECT
·
3 APR
1.Introduction: Review of the UK's evidence base on Covid in schools
COUNTER DISINFORMATION PROJECT
·
30 MAR


